Editor Windows
Broadcaster ships with two editor windows that make the bus observable: a catalog of every event in your project that can also fire events, and a timeline that records every dispatch as it happens. Both are pure consumers of the bus's internal monitor hooks.
Both windows live under the Tools > Sideways Experiments > Broadcaster menu.

Events window
Tools > Sideways Experiments > Broadcaster > Events
The Events window catalogs every event type in your project (anything implementing ISignal, ICue, ICommand, ICommand<T>, or IRequest<T>) and lets you draft and fire any of them without writing throwaway code. It works in edit mode as well as play mode.
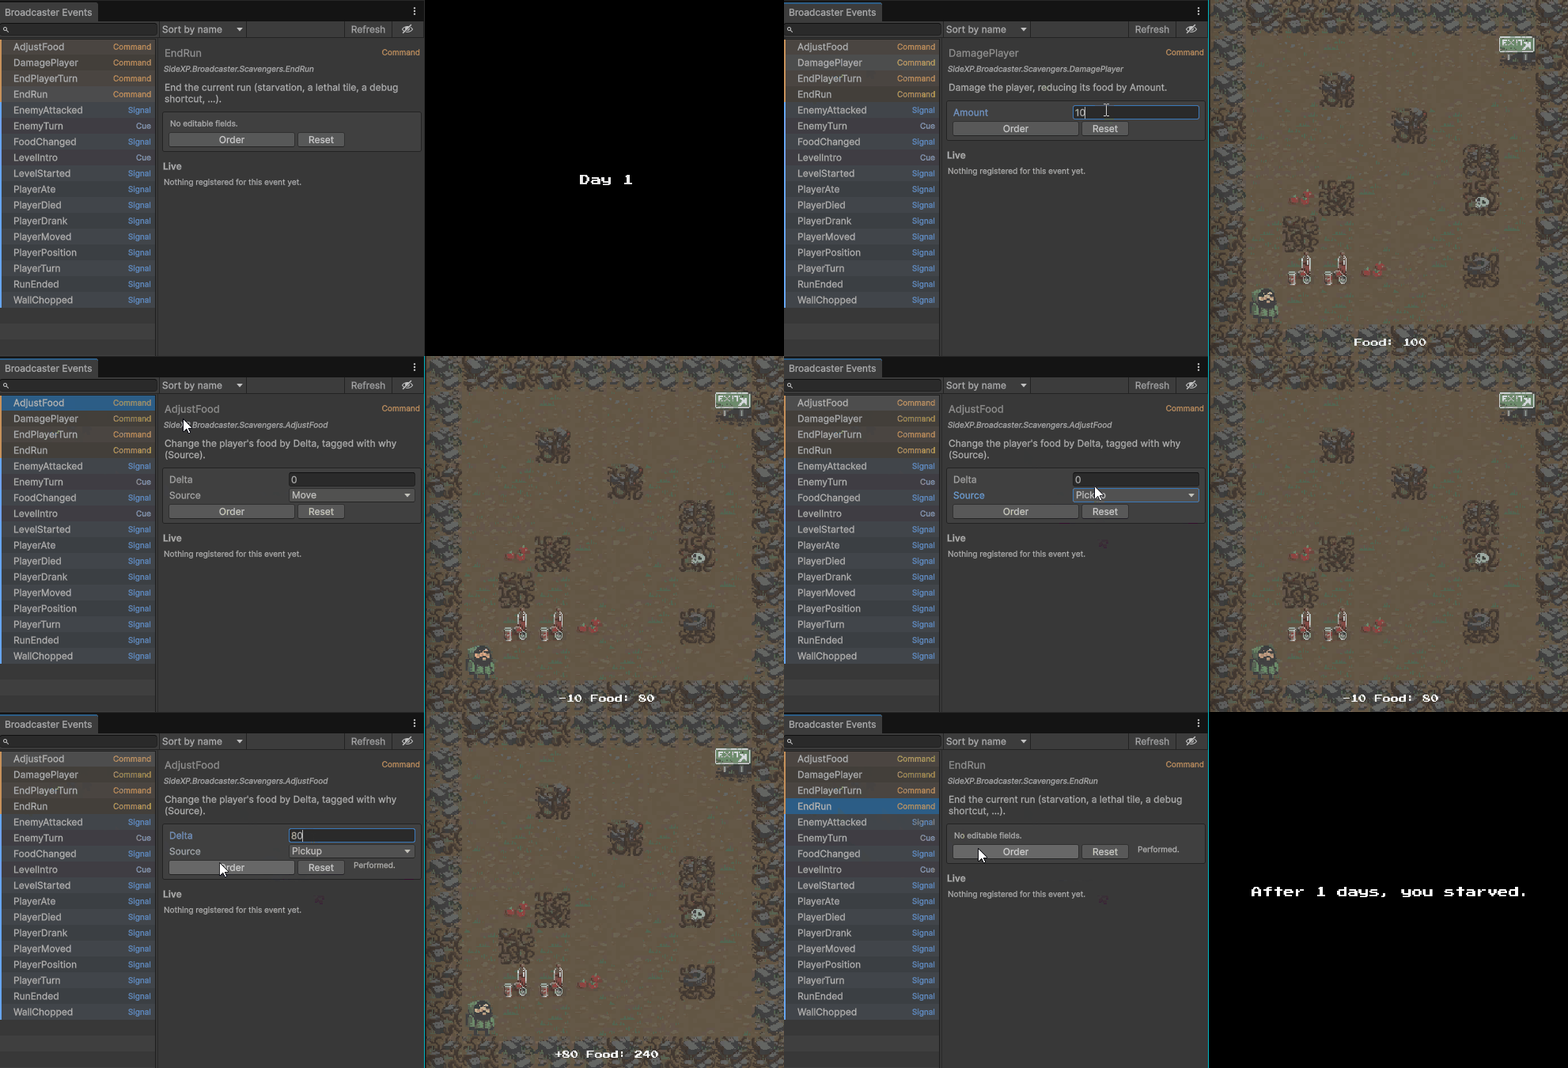
The catalog (left pane)
The left pane is a searchable tree of event types, nested by each event's display-name path (the Name you give in [Event(Name = "Combat/Damaged")] becomes a folder path). The toolbar above it holds:
- Search field: filter the tree by event name
- Sort dropdown: Sort by name (alphabetical) or Sort by kind (grouped by kind, then alphabetical).
- Refresh: rebuild the catalog. The catalog is rebuilt automatically after every recompile though.
- Eye toggle: reveal events marked
[Event(Hidden = true)], which are left out by default.
Draft and fire (right pane)
Select an event to open its details: the display name, full type name, kind tag, and the [Event] description. Below that is the emit box:
- An editor for the event's public fields, so you can set the payload.
- A fire button labelled for the kind (Emit a signal, Cue a cue, Order a command, Ask a request). For a valued command or a request it also shows the result type (for example
Ask → Vector2Int). - A Reset button to restore the draft to defaults.
- An inline result summary after firing: the ack for a command, the returned value for a request, or live completion for a cue (it updates from "in progress" to "performed", "cancelled", or "faulted" as the performers finish).
An event type without a public parameterless constructor, or with no editable fields, is reported in place rather than drafted.
Live status
The Live section at the bottom of the details pane shows what is currently registered for the selected event, but only in play mode. What it reports depends on the kind:
- Signal: the listener count, and whether a provider is alive.
- Cue: the performer count.
- Command / Request: the handler's owner, or "no handler".
Timeline window
Tools > Sideways Experiments > Broadcaster > Timeline
The Timeline window is a profiler-style view of the dispatches the bus reported. Time runs left to right; each dispatch is a bar, the callbacks it invoked show as sub-segments, cascades link a parent dispatch to the ones it triggered, and violations mark where the bus was misused.
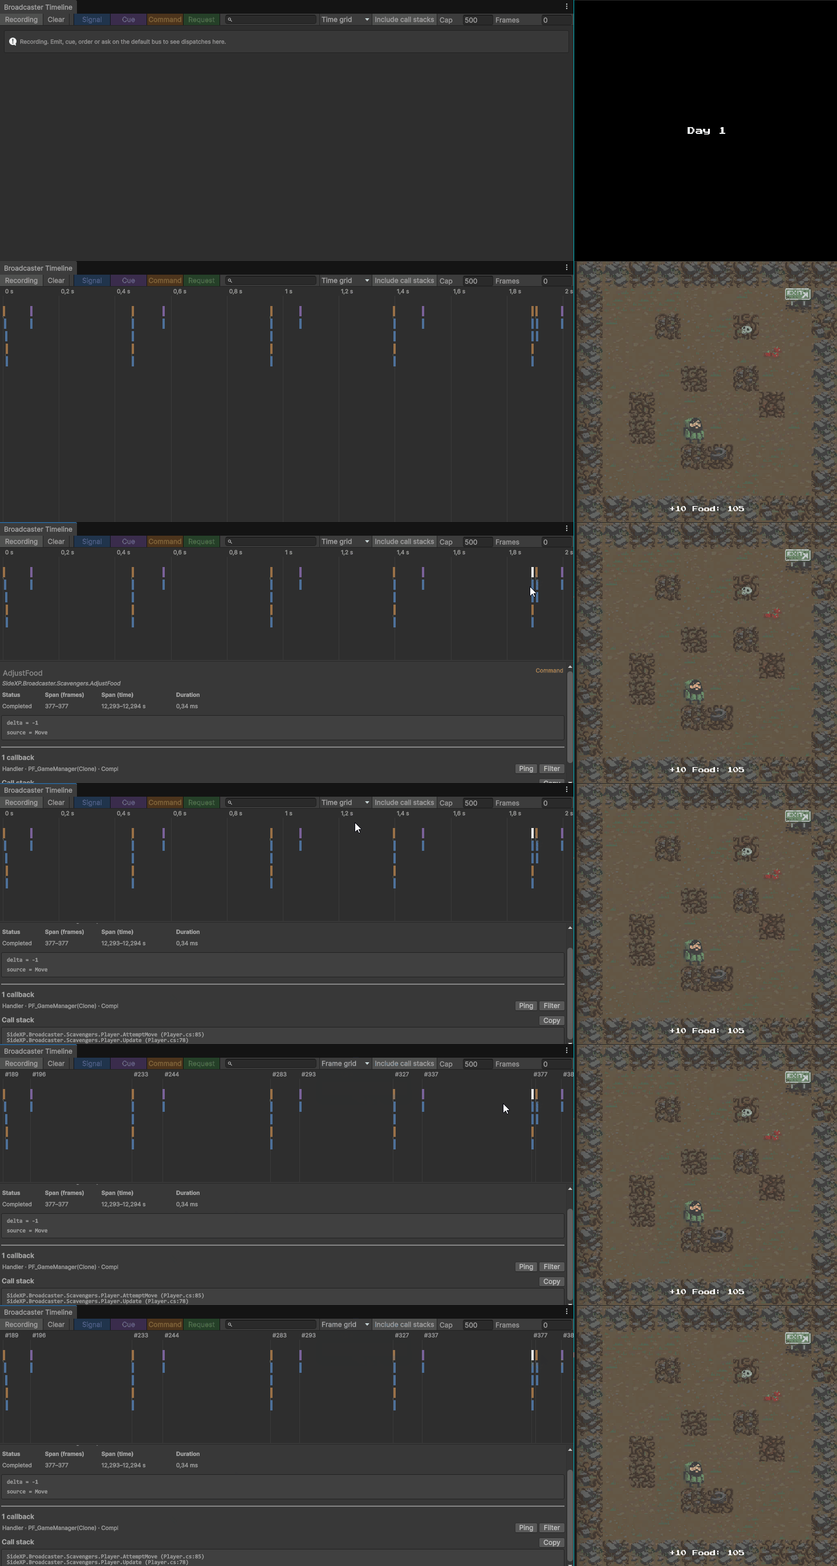
Reading the timeline
- A synchronous dispatch (a signal emit, a sync order/ask) has near-zero duration and is drawn as a point.
- A cue or an async order/ask stretches into a block for as long as it runs, with a sub-segment per callback so a slow performer is visible.
- Cascade edges: link a dispatch to the dispatches it triggered (a listener that emits from inside its callback). For synchronous cascades the parent link is exact; across async continuations it is best-effort, so the windows may show temporal overlap without a hard edge.
- Violations: an unhandled command, a second handler, a synchronous call on an async handler (appear in the strip along the top, in place on the timeline).
Toolbar controls
- Recording / Paused: toggle whether new dispatches are recorded.
- Clear: drop all recorded spans. The recorder otherwise keeps its history across play-mode transitions, so a session's timeline doesn't vanish when you stop.
- Cap: the maximum number of dispatches kept in memory; the oldest are dropped past this.
- Frames: keep only dispatches from the last N frames (
0= unlimited), so a long session's timeline doesn't compress endlessly. - Include call stacks: capture the C# call stack of each emit, shown in a selected span's Emitter section. This is costly and only affects dispatches recorded while it's on, so leave it off until you need to find who emitted something.
- Search field: filter by event type name.
- Kind toggles: show or hide Signals, Cues, Commands, and Requests independently.
- Graduation dropdown: rule the canvas by Time grid (elapsed time) or Frame grid (the frames dispatches occurred in).
Inspecting a dispatch
Select a bar to open the detail pane below the canvas. It shows the event's payload snapshot, the callbacks it invoked with their outcomes, and (when call-stack capture was on) the emitter's stack. Each owner listed there has a Ping button to highlight it in the Hierarchy/Project and a Filter button to narrow the timeline to that owner. The active owner filter shows as a chip in the toolbar with an ✕ to clear it. A Copy button copies the span's details.
When windows show nothing
Both windows read from the shared default bus (Broadcaster.Default), and re-point themselves at the current bus across play-mode transitions. If you route events through your own EventBus instance instead of the façade, these windows won't see them. That isolation is exactly why a private bus is useful in tests, but it means the tooling only observes traffic on the default bus.